Free Access
Fig. 4
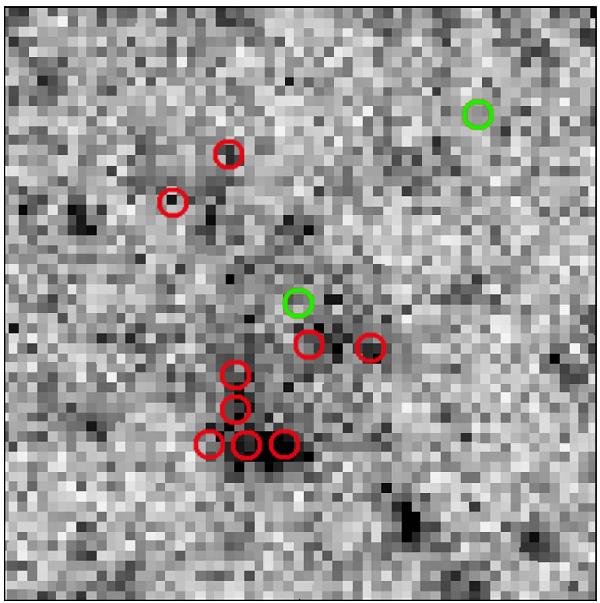
Our observations plotted over a 4′ × 4′ zoom around M 86 at 350 μm. The far-infrared image is taken from the first public data release of the Herschel Virgo Cluster Survey (HeVICS), which was initially presented in Davies et al. (2010). The CO positions are color-coded as in Fig. 3.
Current usage metrics show cumulative count of Article Views (full-text article views including HTML views, PDF and ePub downloads, according to the available data) and Abstracts Views on Vision4Press platform.
Data correspond to usage on the plateform after 2015. The current usage metrics is available 48-96 hours after online publication and is updated daily on week days.
Initial download of the metrics may take a while.