Free Access
Fig. 3
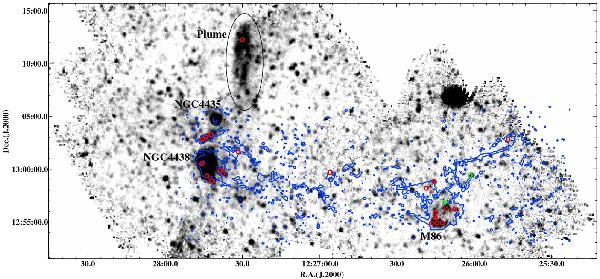
Our CO observation positions (red circles) and positions of previous CO observations (Wiklind et al. 1995; Braine et al. 1997; green circles), over Herschel 250 μm SPIRE imaging data (adapted from Cortese et al. 2010b). The Hα intensity contours are overplotted in blue.
Current usage metrics show cumulative count of Article Views (full-text article views including HTML views, PDF and ePub downloads, according to the available data) and Abstracts Views on Vision4Press platform.
Data correspond to usage on the plateform after 2015. The current usage metrics is available 48-96 hours after online publication and is updated daily on week days.
Initial download of the metrics may take a while.