Fig. 1
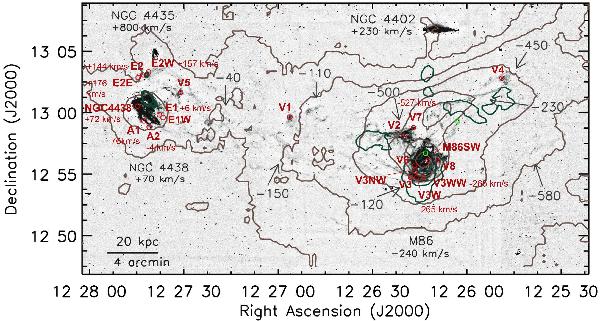
Finding chart of our observations. The positions of previous CO observations (Wiklind et al. 1995; Braine et al. 1997) are marked with light green circles. HI line contours (dark green) and X-ray contours (brown) are plotted over the narrow band Hα + [N ii] image of Virgo’s core (adapted from Kenney et al. 2008). The velocities appearing in gray correspond to those of the Hα gas as measured by the same authors. In red, we mark the Hα clouds that we observed searching for associated CO emission. Upon detection, we also indicate the velocity of the molecular gas traced by the 12CO(1−0) line. In addition to these 20 regions, we also observed at 12:27:30.0+13:12:12.0, northwest of NGC 4435, in the clouds that Cortese et al. (2010a) denote as plume.
Current usage metrics show cumulative count of Article Views (full-text article views including HTML views, PDF and ePub downloads, according to the available data) and Abstracts Views on Vision4Press platform.
Data correspond to usage on the plateform after 2015. The current usage metrics is available 48-96 hours after online publication and is updated daily on week days.
Initial download of the metrics may take a while.