Free Access
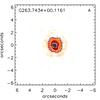
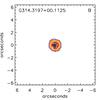
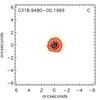
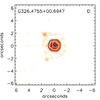
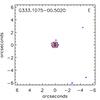
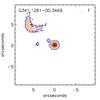
Fig. 2
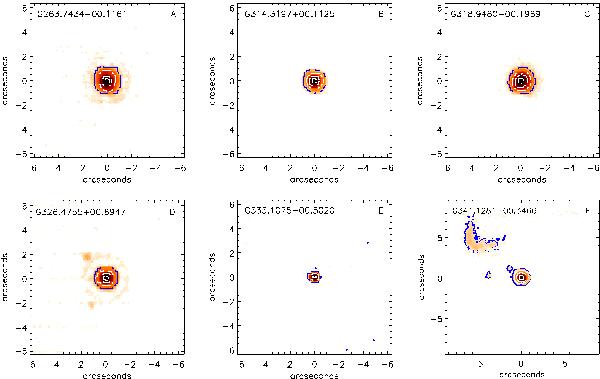
Unresolved sources. The images are scaled logarithmically. North is to the top of the page and east is to the left. The contours typically represent 1, 5, 25 and 75 percent of the peak flux.
This figure is made of several images, please see below:
Current usage metrics show cumulative count of Article Views (full-text article views including HTML views, PDF and ePub downloads, according to the available data) and Abstracts Views on Vision4Press platform.
Data correspond to usage on the plateform after 2015. The current usage metrics is available 48-96 hours after online publication and is updated daily on week days.
Initial download of the metrics may take a while.