Fig. 8
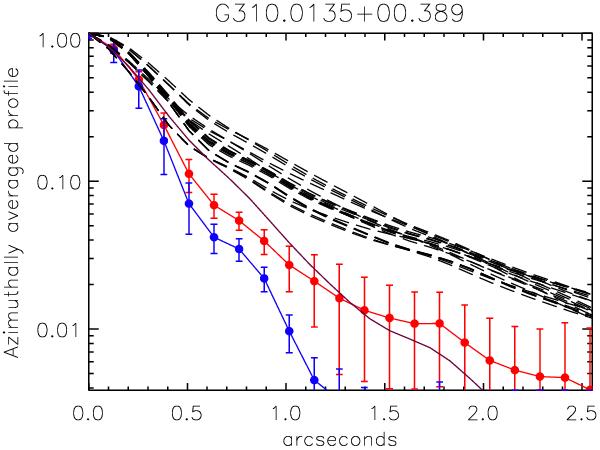
The azimuthally averaged intensity profile of G310.0135 (upper circles) compared to a PSF standard (lower circles) and the models that fit the SED of this object from Mottram et al. (2011, dashed lines). The solid line is the radial profile of the model of Kraus et al. (2010). The error bars represent the rms within a given annuli and thus represent an upper limit on the uncertainty in the flux distribution.
Current usage metrics show cumulative count of Article Views (full-text article views including HTML views, PDF and ePub downloads, according to the available data) and Abstracts Views on Vision4Press platform.
Data correspond to usage on the plateform after 2015. The current usage metrics is available 48-96 hours after online publication and is updated daily on week days.
Initial download of the metrics may take a while.