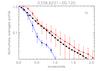
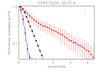
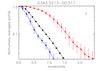
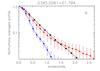
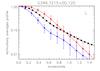
Fig. 7
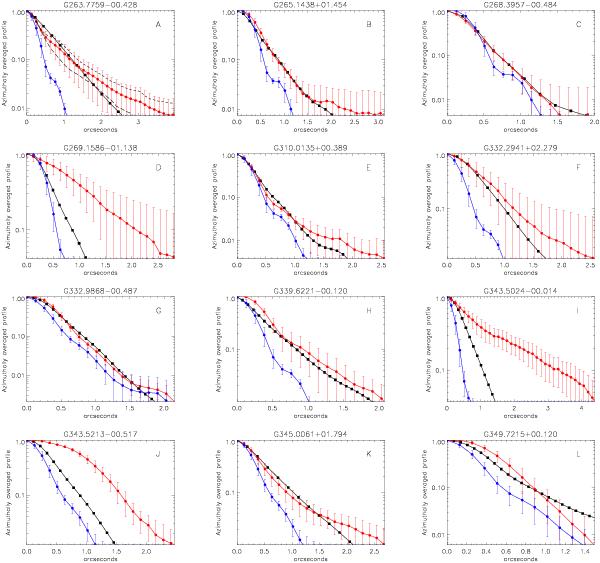
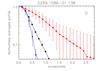
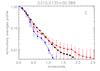
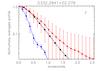
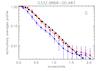
The azimuthally averaged intensity profiles of the resolved MYSOs (upper circles) alongside the model radial profiles (squares) and the associated PSF standard (lower circles). The lower limit to the y axis is set to the root-mean-square noise in the background of the MYSO images. The upper limit of the x is axis is set to the distance at which the MYSO profiles fall to the level of the background noise. The radial profile of G263.7759–00.4281 is also shown averaged over the upper and lower half of its bipolar morphology separately (short and long dashed lines respectively). The error bars represent the RMS within a given annuli and thus represent an upper limit on the uncertainty in the flux distribution.
Current usage metrics show cumulative count of Article Views (full-text article views including HTML views, PDF and ePub downloads, according to the available data) and Abstracts Views on Vision4Press platform.
Data correspond to usage on the plateform after 2015. The current usage metrics is available 48-96 hours after online publication and is updated daily on week days.
Initial download of the metrics may take a while.