Free Access
Fig. 5
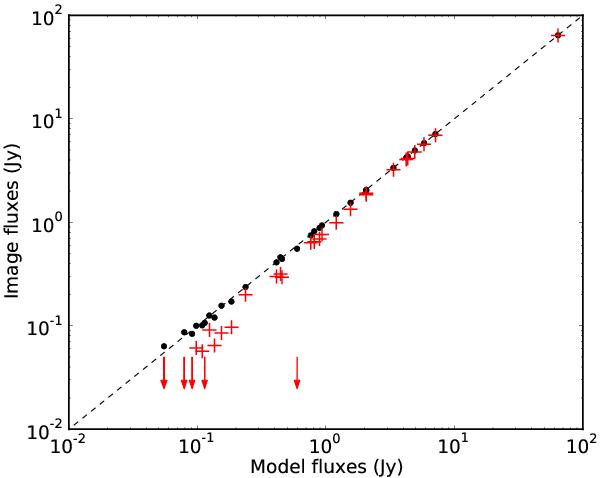
Reconstructed source fluxes compared to those of the input model. Dark circles denote the fsimager reconstruction while light crosses denote the 2+1D reconstruction. Arrows indicate upper levels of reconstructed fluxes that were not located by our search algorithm.
Current usage metrics show cumulative count of Article Views (full-text article views including HTML views, PDF and ePub downloads, according to the available data) and Abstracts Views on Vision4Press platform.
Data correspond to usage on the plateform after 2015. The current usage metrics is available 48-96 hours after online publication and is updated daily on week days.
Initial download of the metrics may take a while.