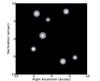
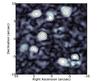
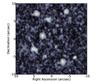
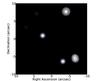
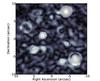
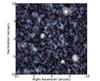
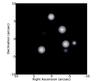
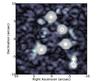
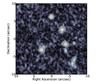
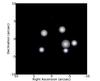
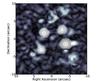
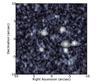
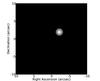
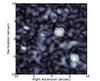
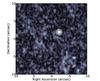
Fig. 3

A comparison between the input model and the two reconstructions at several φ values. In each frame, the greyscale varies linearly from 0–50 mJy/beam, and the contours begin at 50 mJy/beam with a factor of 2 between each level. Left: the model image convolved with an (0.8′′ × 0.8′′ × 40 rad/m2) Gaussian. Middle: the 2+1D reconstruction. Right: the fsimager reconstruction. Top to bottom: φ = −205, − 160, 200, 230, and 395 rad/m2.
Current usage metrics show cumulative count of Article Views (full-text article views including HTML views, PDF and ePub downloads, according to the available data) and Abstracts Views on Vision4Press platform.
Data correspond to usage on the plateform after 2015. The current usage metrics is available 48-96 hours after online publication and is updated daily on week days.
Initial download of the metrics may take a while.