Fig. 2
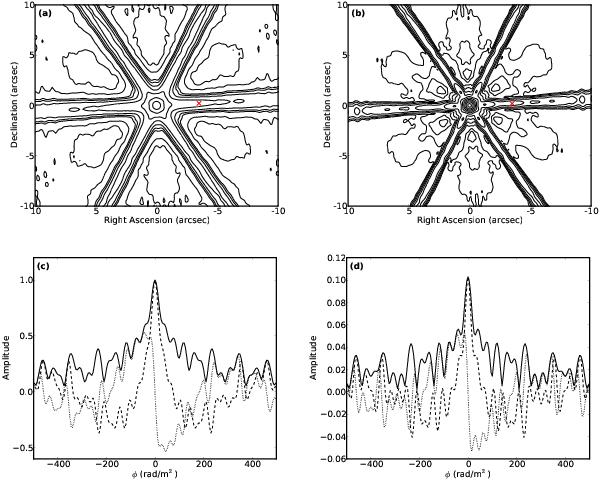
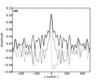
The 3D dirty beam. a) A 2D slice through the cube in the sky plane at φ = 0 rad/m2. The magnitude of the complex valued beam is shown. The bottom contour begins at 0.01 and there is a step of 2 between levels. Negative contours are marked with dashed lines. b) Another view of the beam, now at φ = 50 rad/m2. c) A 1D profile through the center of the sky plane at (0′′, 0′′). d) A 1D profile along the LOS at ( − 3.5′′, 0.2′′), marked with an “ × ” in a) and b). The magnitude of the profiles are shown as a solid line, while dashed and dotted lines indicate the real and imaginary parts, respectively.
Current usage metrics show cumulative count of Article Views (full-text article views including HTML views, PDF and ePub downloads, according to the available data) and Abstracts Views on Vision4Press platform.
Data correspond to usage on the plateform after 2015. The current usage metrics is available 48-96 hours after online publication and is updated daily on week days.
Initial download of the metrics may take a while.