Fig. 3
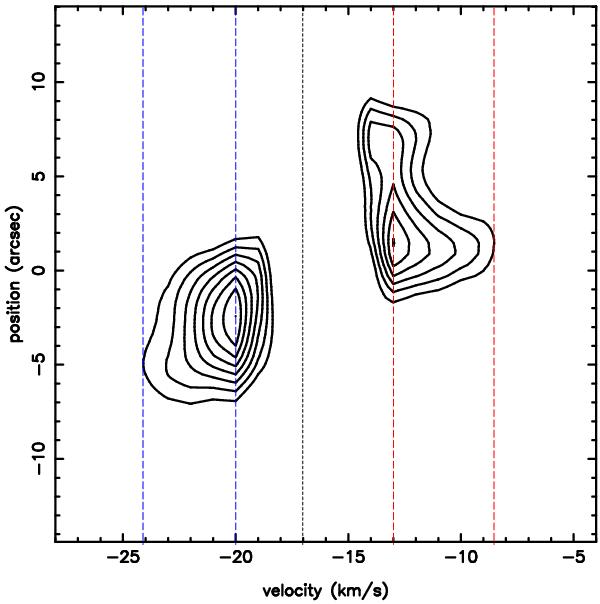
The position-velocity plot of the 12CO(2−1) emission at a position angle of −40°. The contour levels are 1.4, 1.8, 2.3, 2.7, 3.2, 3.6, 4.1, and 4.5 Jy beam-1, and 1 σ is 0.7 Jy beam-1. The black vertical dashed line marks the cloud systemic velocity. The blue and red vertical dashed lines mark the velocity ranges of the blueshifted and redshifted emission, respectively.
Current usage metrics show cumulative count of Article Views (full-text article views including HTML views, PDF and ePub downloads, according to the available data) and Abstracts Views on Vision4Press platform.
Data correspond to usage on the plateform after 2015. The current usage metrics is available 48-96 hours after online publication and is updated daily on week days.
Initial download of the metrics may take a while.