Free Access
Fig. 2
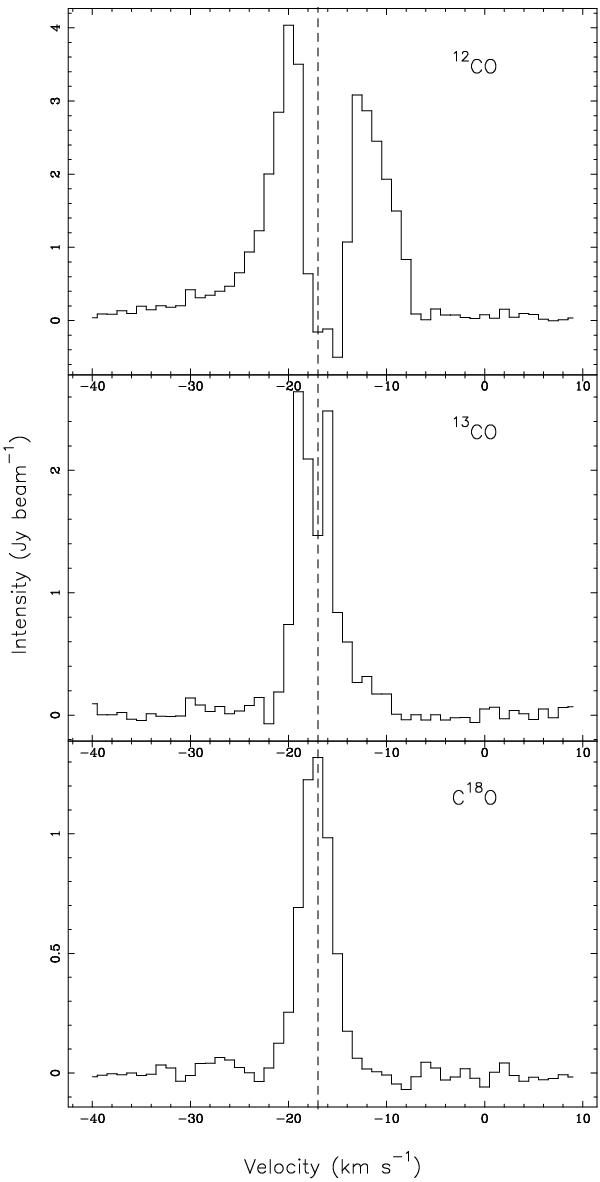
Spectral profiles observed at the central position of IRAS 04579+4703 in the optically thick 12CO(2−1), 13CO(2−1) lines, and the optically thin C18O(2−1) line. The dotted line in the spectra marks the cloud systemic velocity.
Current usage metrics show cumulative count of Article Views (full-text article views including HTML views, PDF and ePub downloads, according to the available data) and Abstracts Views on Vision4Press platform.
Data correspond to usage on the plateform after 2015. The current usage metrics is available 48-96 hours after online publication and is updated daily on week days.
Initial download of the metrics may take a while.