Fig. 1
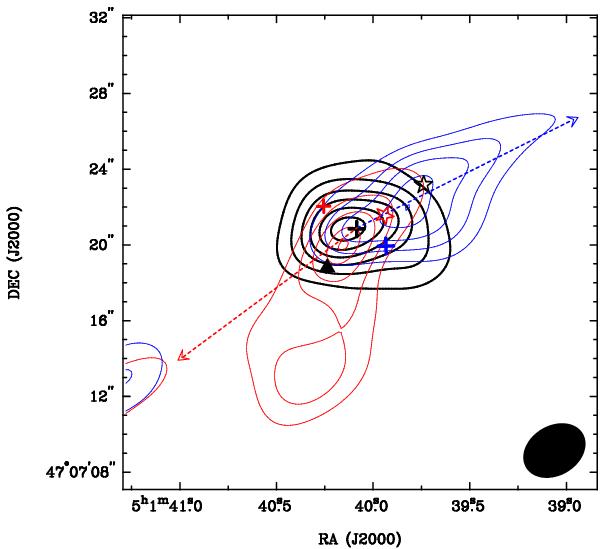
The 1.3 mm continuum emission (black thicker contours) overlaid with the velocity-integrated intensity map of 12CO(2−1) outflow (red and blue contours). The black contour levels are at 3, 6, 9, 12, 15, 18, and 21σ (1σ is 0.002 Jy beam-1). The red and blue contour levels are 35, 50,..., 95% of the peak value. The synthesized beam is  , PA = –58.9° (shown in the lower right corner). The black plus symbol marks the peak position of the continuum source. The blue and red plus symbols represent the positions of the extracted spectra in Fig. 4, respectively. The H2O maser is shown by a filled triangle. The black and red open star symbols indicate the location of the infrared source IRAS 04579+4703 and a near-IR source detected by Varricatt et al. (2010), respectively. The blue and red dashed lines mark the directions of the NW and SE lobes of the H2 knots (Varricatt et al. 2010), respectively.
Current usage metrics show cumulative count of Article Views (full-text article views including HTML views, PDF and ePub downloads, according to the available data) and Abstracts Views on Vision4Press platform.
Data correspond to usage on the plateform after 2015. The current usage metrics is available 48-96 hours after online publication and is updated daily on week days.
Initial download of the metrics may take a while.