Fig. 7
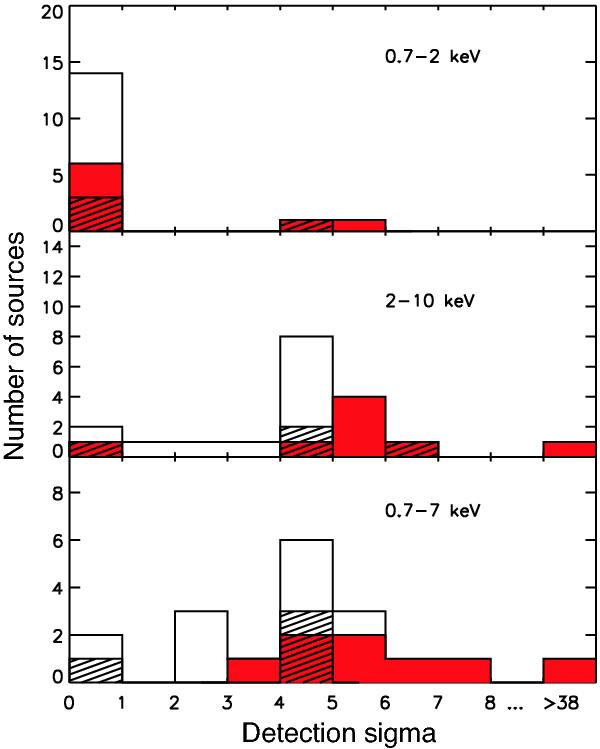
The source detection significances of the ASCA Galactic plane survey are shown for the 3 energy bands investigated in that work (Sugizaki et al. 2001). Swift/XRT non-detected sources are represented by the solid black line, the firmly detected sources are coloured red and tentative detections are indicated by hatched lines. These three different groups are overlaid in the graph (i.e., it is not cumulative).
Current usage metrics show cumulative count of Article Views (full-text article views including HTML views, PDF and ePub downloads, according to the available data) and Abstracts Views on Vision4Press platform.
Data correspond to usage on the plateform after 2015. The current usage metrics is available 48-96 hours after online publication and is updated daily on week days.
Initial download of the metrics may take a while.