Free Access
Fig. 6
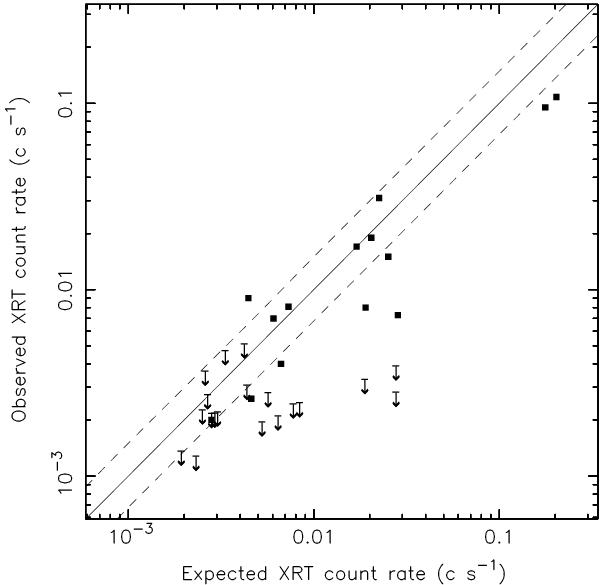
Observed versus expected XRT count rates for both detected and undetected sources in our sample (represented by squares and upper limit symbols, respectively). The solid line corresponds to a ratio of observed over expected count rates that equals unity, whereas the dashed lines represents 1σ deviations from this relation.
Current usage metrics show cumulative count of Article Views (full-text article views including HTML views, PDF and ePub downloads, according to the available data) and Abstracts Views on Vision4Press platform.
Data correspond to usage on the plateform after 2015. The current usage metrics is available 48-96 hours after online publication and is updated daily on week days.
Initial download of the metrics may take a while.