Fig. 4
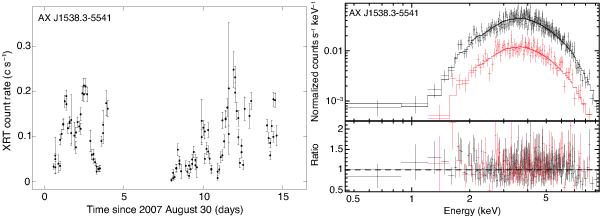
Swift/XRT results for AX J1538.3–5541. Left: X-ray count rate light curve of the epoch of 2007 August–September (binned per satellite orbit). Right: comparison of the X-ray spectra at high (average of 0.16 c s-1; top, black) and low (average of 0.04 c s-1; bottom, red) count rates, using all available Swift/XRT observations of the source. The solid lines indicate the best-fit results to an absorbed powerlaw model. The lower panel indicates the data to model ratio of the fits.
Current usage metrics show cumulative count of Article Views (full-text article views including HTML views, PDF and ePub downloads, according to the available data) and Abstracts Views on Vision4Press platform.
Data correspond to usage on the plateform after 2015. The current usage metrics is available 48-96 hours after online publication and is updated daily on week days.
Initial download of the metrics may take a while.