Fig. 3
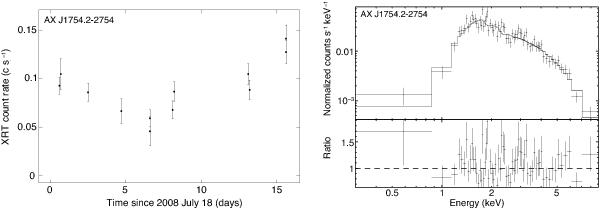
Swift/XRT results for the confirmed neutron star LMXB AX J1754.2–2754. Left: the X-ray light curve observed in 2008 July–August (binned per satellite orbit). Right: the average X-ray spectrum obtained by summing all available data (2007 July–2008 August). The solid line represents the best-fit result to an absorbed powerlaw model and the bottom plot indicates the data to model ratio of the fit.
Current usage metrics show cumulative count of Article Views (full-text article views including HTML views, PDF and ePub downloads, according to the available data) and Abstracts Views on Vision4Press platform.
Data correspond to usage on the plateform after 2015. The current usage metrics is available 48-96 hours after online publication and is updated daily on week days.
Initial download of the metrics may take a while.