Fig. 2
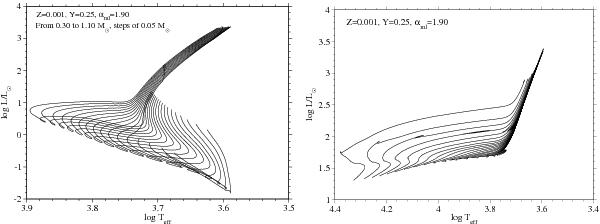
HR diagram for evolutionary tracks in the mass range 0.30 ÷ 1.10 M⊙ for the labeled chemical composition ([α/Fe] = 0.0) and αml = 1.90. Effective temperatures are in K. Left panel: tracks from PMS up to the central hydrogen exhaustion (for masses up to 0.5 M⊙) and tracks from PMS up to the helium flash (for masses 0.55M⊙ ≤ M ≤ 1.10M⊙). Right panel: HB models with a 0.80 M⊙ progenitor, from the ZAHB to thermal pulses.
Current usage metrics show cumulative count of Article Views (full-text article views including HTML views, PDF and ePub downloads, according to the available data) and Abstracts Views on Vision4Press platform.
Data correspond to usage on the plateform after 2015. The current usage metrics is available 48-96 hours after online publication and is updated daily on week days.
Initial download of the metrics may take a while.