Fig. 4
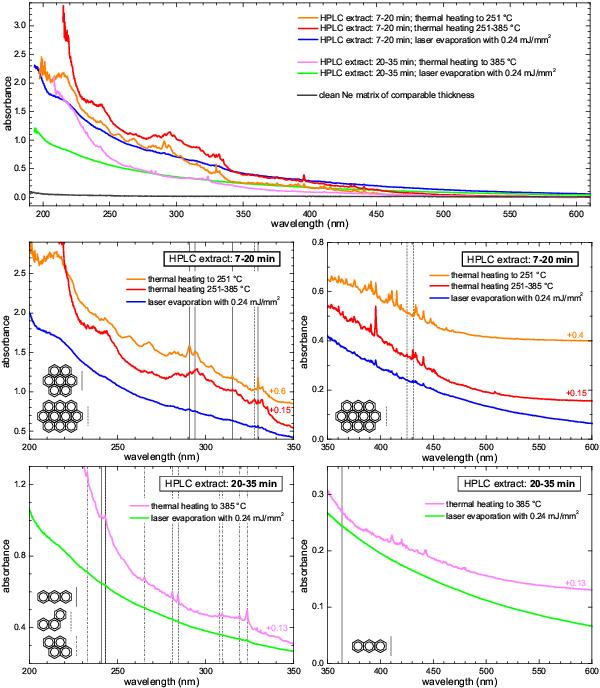
Absorption spectra of PAH mixtures obtained after HPLC fractionization of the soluble laser pyrolysis condensate. The molecules were incorporated into solid Ne matrices kept at 5.5 K. A clean Ne matrix of comparable thickness is shown for comparison. Top panel: overview over all measurements. The spectra were corrected for weak baseline variations, mainly caused by differences in the sample reflectivity, by shifting them to zero absorbance at 850 nm. Other panels: numbers given at the right-hand side indicate that the spectra were shifted in y-direction for a better comparison. The vertical lines mark the band positions of PAHs that could be identified based on their characteristic peaks in the Ne matrix spectra. The structures of the corresponding molecules are displayed, accordingly.
Current usage metrics show cumulative count of Article Views (full-text article views including HTML views, PDF and ePub downloads, according to the available data) and Abstracts Views on Vision4Press platform.
Data correspond to usage on the plateform after 2015. The current usage metrics is available 48-96 hours after online publication and is updated daily on week days.
Initial download of the metrics may take a while.