Free Access
Fig. 3
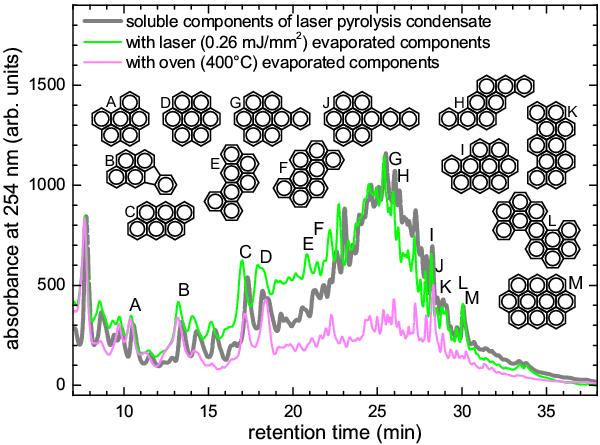
Comparison of the HPLC spectrum of the original condensate obtained by laser pyrolysis with the spectra measured after the same material has been evaporated by either a laser or thermally in an oven. The peaks labeled with the letters “A” to “M” correspond to the displayed identified PAHs.
Current usage metrics show cumulative count of Article Views (full-text article views including HTML views, PDF and ePub downloads, according to the available data) and Abstracts Views on Vision4Press platform.
Data correspond to usage on the plateform after 2015. The current usage metrics is available 48-96 hours after online publication and is updated daily on week days.
Initial download of the metrics may take a while.