Fig. 3
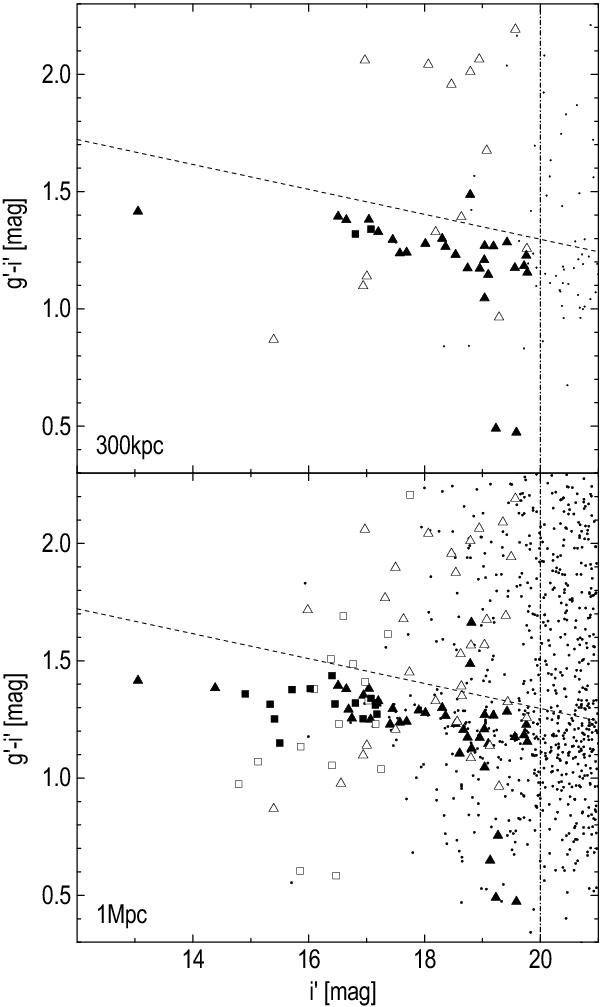
Colour–magnitude diagrams for all galaxies within 300 kpc and 1 Mpc. Galaxies with spectra are shown as triangles (this work) and squares (literature). Small dots are photometrically classified SDSS galaxies with i′ < 21 mag. Filled symbols show spectroscopically confirmed group members whilst open ones are background galaxies. Group members form a tight red sequence of ~0.4 mag thickness. The dashed lines show the adopted upper limit of this sequence g′ − i′ = −0.05317 × i′ + 2.36. Vertical lines show the magnitude limit (i′ = 20 mag) for the spectroscopic target selection.
Current usage metrics show cumulative count of Article Views (full-text article views including HTML views, PDF and ePub downloads, according to the available data) and Abstracts Views on Vision4Press platform.
Data correspond to usage on the plateform after 2015. The current usage metrics is available 48-96 hours after online publication and is updated daily on week days.
Initial download of the metrics may take a while.