Free Access
Fig. 11
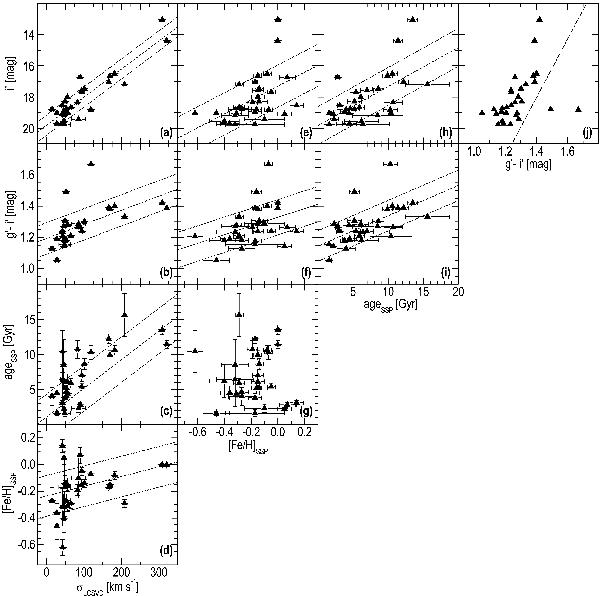
Scaling relations for the studied galaxy population in the RX J1548.9+0851 system. Dashed lines are linear least squares fits to the data. Dotted lines indicate one-sigma confidence intervals. The dash-dotted line in panel j) is the red sequence upper limit as shown in Fig. 3.
Current usage metrics show cumulative count of Article Views (full-text article views including HTML views, PDF and ePub downloads, according to the available data) and Abstracts Views on Vision4Press platform.
Data correspond to usage on the plateform after 2015. The current usage metrics is available 48-96 hours after online publication and is updated daily on week days.
Initial download of the metrics may take a while.