Fig. 7
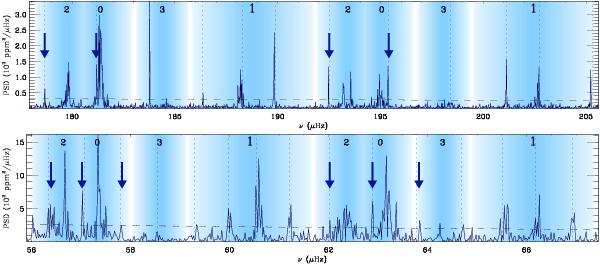
Overlapping mixed modes identified a posteriori in the power density spectra of three red giants. Vertical dotted lines correspond to the dipole mixed-mode frequencies determined using the asymptotic fit. Arrows indicate the modes assigned a posteriori to ℓ = 1 mixed modes. The dashed lines show the threshold level corresponding to eight times the stellar background. Top, KIC 9882316: additional peaks close to the ℓ = 2 and 0 patterns present the characteristics of g-m modes, with a very narrow linewidth. Bottom, KIC 2013502: the peaks at 56.34, 57.06, 57.79, 62.02, 62.88, and 63.77 μHz, that is, close to the uninterrupted series of g-m modes, seem to be ℓ = 1 mixed modes. This is not rare.
Current usage metrics show cumulative count of Article Views (full-text article views including HTML views, PDF and ePub downloads, according to the available data) and Abstracts Views on Vision4Press platform.
Data correspond to usage on the plateform after 2015. The current usage metrics is available 48-96 hours after online publication and is updated daily on week days.
Initial download of the metrics may take a while.