Fig. 3
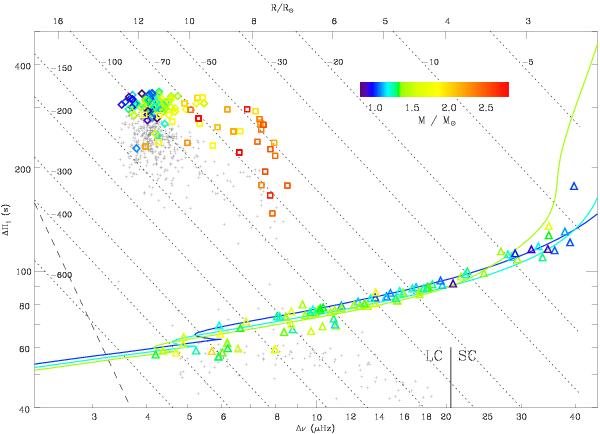
Gravity-mode period spacing ΔΠ1 as a function of the pressure-mode large frequency spacing Δν. Long-cadence data (LC) have Δν ≤ 20.4 μHz. RGB stars are indicated by triangles; clump stars by diamonds; secondary clump stars by squares. Uncertainties in both parameters are smaller than the symbol size. The seismic estimate of the mass is given by the color code. Small gray crosses indicate the bumped periods ΔPobs measured by Mosser et al. (2011a). Dotted lines are ng isolines. The dashed line in the lower left corner indicates the formal frequency resolution limit. The upper x-axis gives an estimate of the stellar radius for a star whose νmax is related to Δν according to the mean scaling relation νmax = (Δν/0.28)1.33 (both frequencies in μHz). The solid colored lines correspond to a grid of stellar models with masses of 1, 1.2 and 1.4 M⊙, from the ZAMS to the tip of the RGB.
Current usage metrics show cumulative count of Article Views (full-text article views including HTML views, PDF and ePub downloads, according to the available data) and Abstracts Views on Vision4Press platform.
Data correspond to usage on the plateform after 2015. The current usage metrics is available 48-96 hours after online publication and is updated daily on week days.
Initial download of the metrics may take a while.