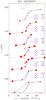
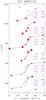
Fig. 2
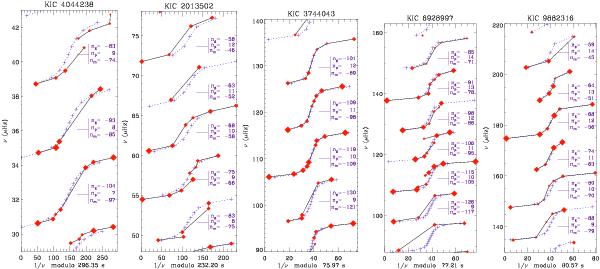
Period échelle diagrams of five representative stars, two in the clump (two left-most panels) and three on the RGB, sorted by increasing Δν. The x-axis shows the period modulo of the gravity spacing ΔΠ1; the y-axis is the frequency. Diamonds indicate the observed modes, with a size proportional to the mode height. Dashed lines and crosses correspond to the asymptotic fit. Pressure and gravity orders (np, ng, respectively) and mixed-mode index nm are given for the mixed modes located near the pressure radial modes. The most p mode-like part of the pattern is located in the middle of the range, at 1/ν = ΔΠ1/2 (moduloΔΠ1).
Current usage metrics show cumulative count of Article Views (full-text article views including HTML views, PDF and ePub downloads, according to the available data) and Abstracts Views on Vision4Press platform.
Data correspond to usage on the plateform after 2015. The current usage metrics is available 48-96 hours after online publication and is updated daily on week days.
Initial download of the metrics may take a while.