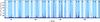
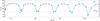
Fig. 1

Top: power density spectrum of the star KIC 9882316, with superimposed mode identification provided by the red giant oscillation universal pattern. Dashed (dotted) lines indicates the position of the peaks a priori (a posteriori) identified as ℓ = 1 mixed modes. P-m modes are located close to the positions marked by 1. Bottom: period spacings ΔP = 1/νnm,1 − 1/νnm + 1,1 between adjacent mixed modes, as a function of the frequency. The full line and small filled diamonds correspond to the convolution model defined by Eqs. (4) and (5); the g-mode spacing ΔΠ1 is indicated by the dotted horizontal line; the dashed line indicates the observed spacing, ΔPobs, which is affected by the mode bumping, measured with the method presented by Mosser et al. (2011a). The large diamonds show the spacing between two observed consecutive modes; full symbols, near the dashed line, correspond to the measurements derived from the modes a priori identified as ℓ = 1 mixed modes; open symbols, just below the dotted line, are obtained from the peaks identified a posteriori as mixed modes.
Current usage metrics show cumulative count of Article Views (full-text article views including HTML views, PDF and ePub downloads, according to the available data) and Abstracts Views on Vision4Press platform.
Data correspond to usage on the plateform after 2015. The current usage metrics is available 48-96 hours after online publication and is updated daily on week days.
Initial download of the metrics may take a while.