Free Access
Fig. 7
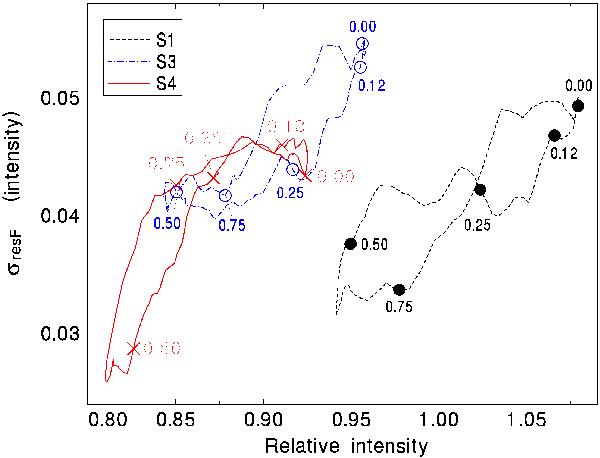
Dependence of the relative intensity and σresF for segments S1, S3, and S4. These data were smoothed by the moving averages with Q = 0.16Φsh. See Sect. 3.2 for details. (This figure is available in color in electronic form.)
Current usage metrics show cumulative count of Article Views (full-text article views including HTML views, PDF and ePub downloads, according to the available data) and Abstracts Views on Vision4Press platform.
Data correspond to usage on the plateform after 2015. The current usage metrics is available 48-96 hours after online publication and is updated daily on week days.
Initial download of the metrics may take a while.