Fig. 6
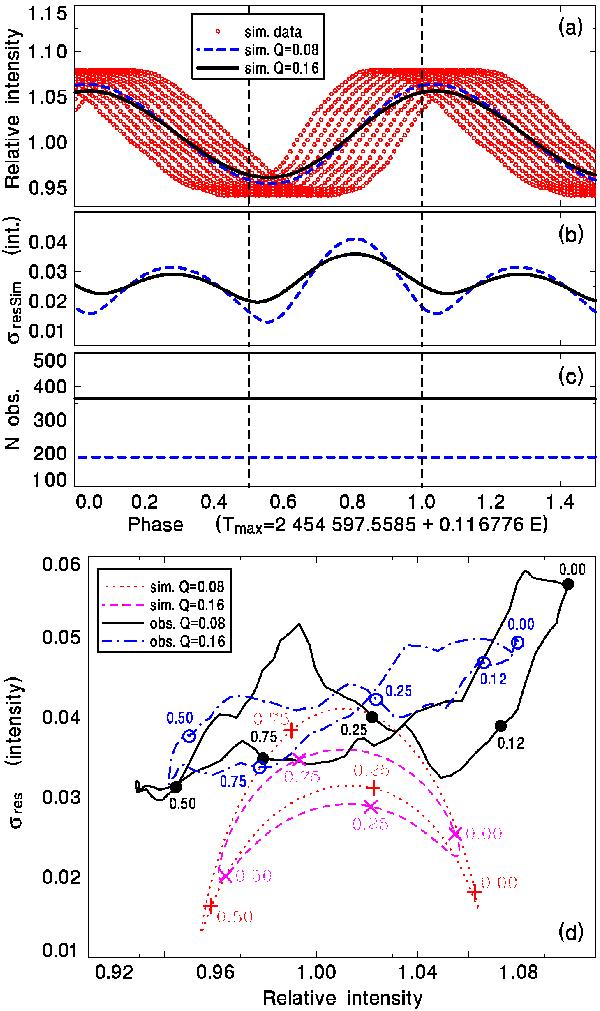
Simulation of the effect of a very unstable Psh in evaluating the scatter of intensity in various Φsh. a) The intensity curve artificially shifted in Φsh. The folded data were smoothed by the two-sided moving averages for various Q (in units of Φsh) (see the legend). b) Smoothed residuals σresSim of the fits. c) The number of data included in calculation of each mean. d) Dependence of the relative intensity and σresSim for the simulated data. They were smoothed by the moving averages with various Q. The observed data for S1 are included, too. Some Φsh are marked. See Sect. 3.2 for details. (This figure is available in color in electronic form.)
Current usage metrics show cumulative count of Article Views (full-text article views including HTML views, PDF and ePub downloads, according to the available data) and Abstracts Views on Vision4Press platform.
Data correspond to usage on the plateform after 2015. The current usage metrics is available 48-96 hours after online publication and is updated daily on week days.
Initial download of the metrics may take a while.