Fig. 2
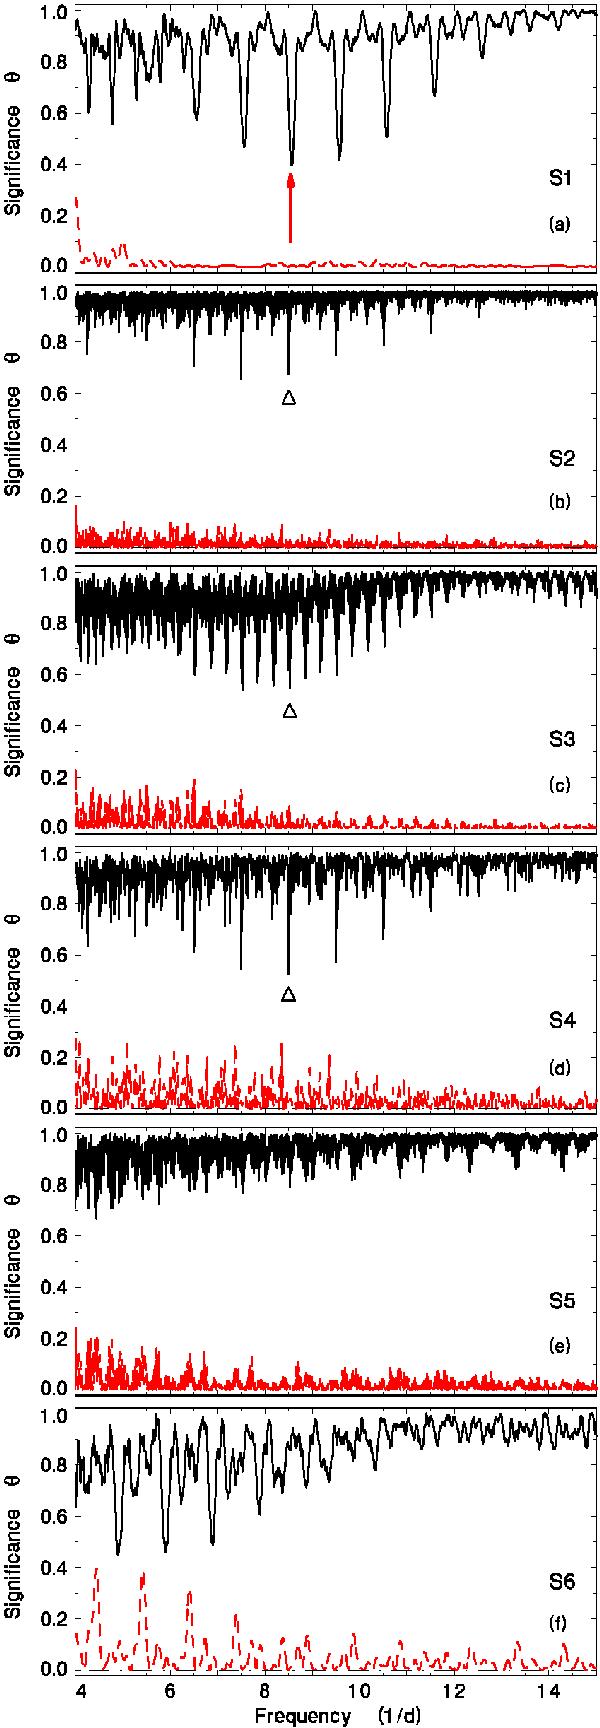
Frequency vs. Θ diagrams of the intensity variations of V795 Her determined by the PDM method (Stellingwerf 1978) for the individual segments abbreviated as S1 to S6 in Fig. 1c. The closer the value of Θ to zero, the more significant the frequency (i.e. period). The spectral window is marked by a dashed line. The arrow marks the best frequency attributed to fsh (hence to 1/Psh) in the top panel. See Sect. 3.2 for details. (This figure is available in color in electronic form.)
Current usage metrics show cumulative count of Article Views (full-text article views including HTML views, PDF and ePub downloads, according to the available data) and Abstracts Views on Vision4Press platform.
Data correspond to usage on the plateform after 2015. The current usage metrics is available 48-96 hours after online publication and is updated daily on week days.
Initial download of the metrics may take a while.