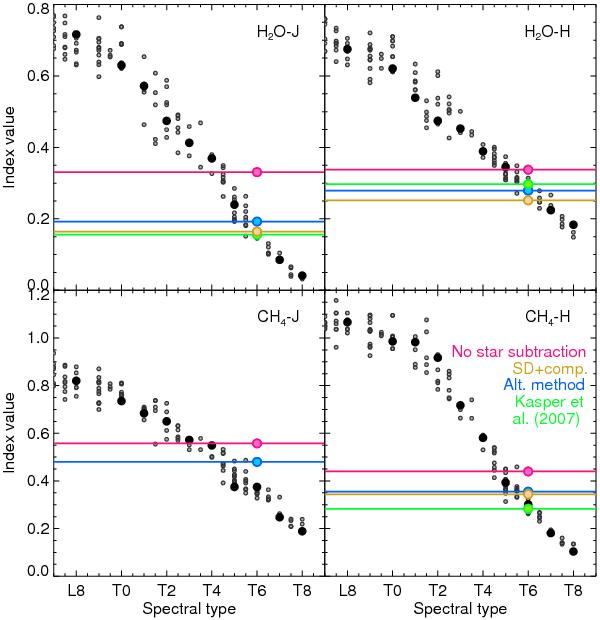
Fig. 8

H2O and CH4 spectral indices defined by Burgasser et al. (2006) for the classification of T dwarfs calculated in the spectra available for SCR 1845 B. For comparison, the grey dots represent the spectral index values for T dwarfs from the SpecX library, and the black dots the values for the reference objects from Burgasser et al. (2006, Table 4) with available SpecX spectrum. The spectral coverage of the Kasper et al. (2007) spectrum does not allow us to measure the CH4-J index. The values of all the spectral indices are summarized in Table 4.
Current usage metrics show cumulative count of Article Views (full-text article views including HTML views, PDF and ePub downloads, according to the available data) and Abstracts Views on Vision4Press platform.
Data correspond to usage on the plateform after 2015. The current usage metrics is available 48-96 hours after online publication and is updated daily on week days.
Initial download of the metrics may take a while.


