Fig. 3
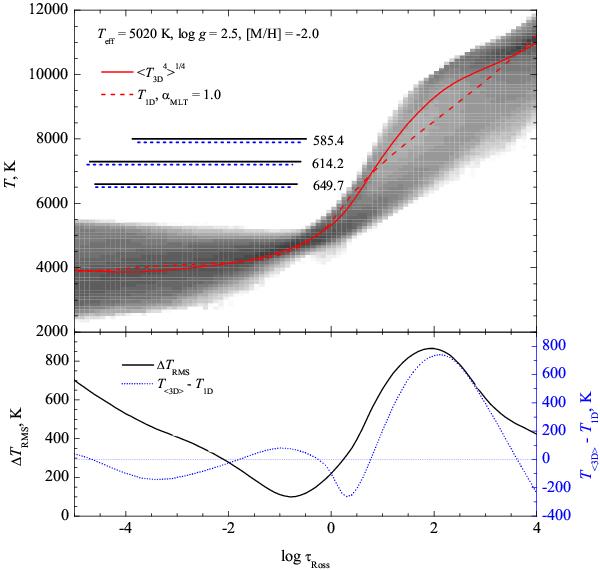
Top panel: temperature stratification in a single snapshot of the 3D hydrodynamical CO5BOLD model at the metallicity [M/H] = –2. Gray shaded area shows the temperature probability density on a logarithmic scale, with darker shades meaning a higher probability of finding a particular temperature value in the 3D model simulation box. The solid red line shows mean temperature stratification of the 3D model and the dashed red line is the 1D LHD model temperature stratification. Horizontal bars show the optical depth intervals where 90% of the line equivalent width is formed: black bars correspond to the 3D model while blue dashed correspond to the 1D. Numbers next to the bars designate the wavelength of the given Ba II line in nm. Bottom panel: rms value of horizontal temperature fluctuations in the 3D model (black line) and temperature difference between the mean 3D and 1D models (blue dashed line).
Current usage metrics show cumulative count of Article Views (full-text article views including HTML views, PDF and ePub downloads, according to the available data) and Abstracts Views on Vision4Press platform.
Data correspond to usage on the plateform after 2015. The current usage metrics is available 48-96 hours after online publication and is updated daily on week days.
Initial download of the metrics may take a while.