Free Access
Fig. 5
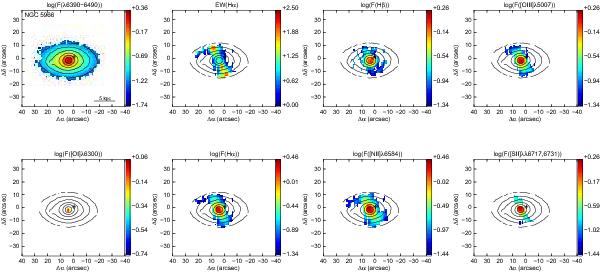
Maps of the emission from NGC 5966. The panels show the same maps as outlined in Fig. 4. See the caption to that figure for details. The pixel size (1″) corresponds to ~334 pc at our assumed distance to NGC 5966 of 69 Mpc.
Current usage metrics show cumulative count of Article Views (full-text article views including HTML views, PDF and ePub downloads, according to the available data) and Abstracts Views on Vision4Press platform.
Data correspond to usage on the plateform after 2015. The current usage metrics is available 48-96 hours after online publication and is updated daily on week days.
Initial download of the metrics may take a while.