Fig. 5
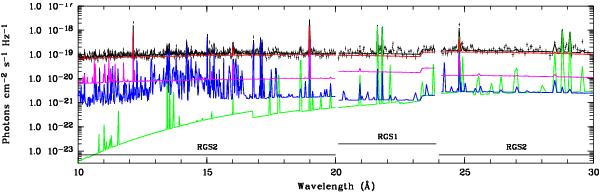
Color-coded “unfolded” model spectra in the range 10–30 Å computed for RGS1 and RGS2 for the fitted model of OBS3. The green, blue, purple, and red denote the normalized emission spectra of plasma components kT1, kT2, kT3, and kT4, each with the single values given in Table 4. The black line is the observed spectrum. The model from the RGS2 detector was used for all wavelengths except for the 20–24 Å gap, and for this gap the RGS1 model was used. This accounts for small discontinuities in the emissions at these wavelengths for the kT2 and kT3 plasma components. The kT3 and kT4 emission are almost as well described by a broad DEM centered at a high energy.
Current usage metrics show cumulative count of Article Views (full-text article views including HTML views, PDF and ePub downloads, according to the available data) and Abstracts Views on Vision4Press platform.
Data correspond to usage on the plateform after 2015. The current usage metrics is available 48-96 hours after online publication and is updated daily on week days.
Initial download of the metrics may take a while.