Fig. 6
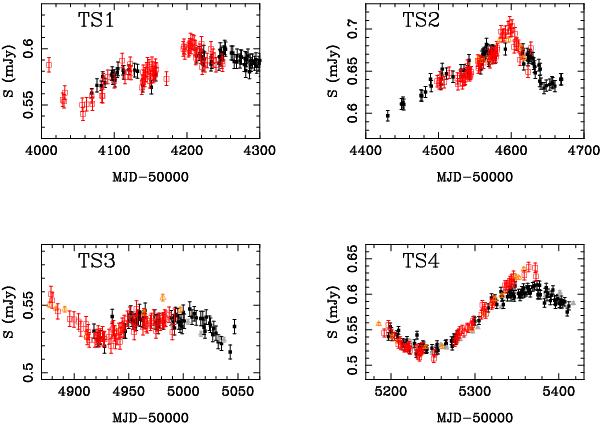
AB comparisons in the r band. We used the original epochs and fluxes of B (open squares), while the fluxes of A are shifted by +420 d and properly amplified (filled squares). Together with these LRT data, we also show the more poorly sampled USNO fluxes of A (filled triangles) and B (open triangles). Top and bottom left panels: comparisons in two periods of normal activity. The A signal is amplified by 1.019 (see main text). Top and bottom right panels: comparisons in two episodes of violent activity. The A signal is amplified by 1.057 (see main text).
Current usage metrics show cumulative count of Article Views (full-text article views including HTML views, PDF and ePub downloads, according to the available data) and Abstracts Views on Vision4Press platform.
Data correspond to usage on the plateform after 2015. The current usage metrics is available 48-96 hours after online publication and is updated daily on week days.
Initial download of the metrics may take a while.