Fig. 2
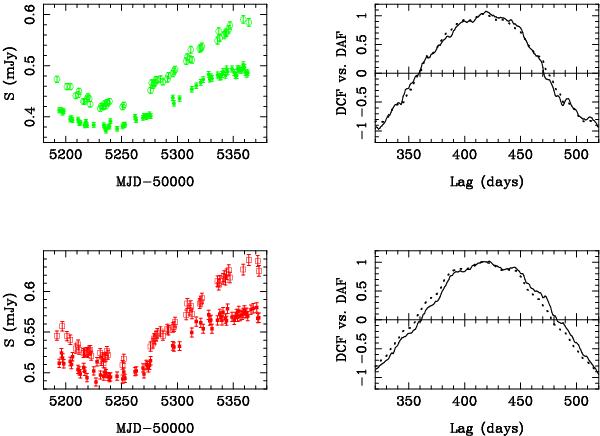
LRT main fluctuations and some of their correlation functions. Top left panel: the fluxes of Q0957+561A (shifted forwards in time in 417 d; filled circles) and Q0957+561B (open circles) in the g band. Top right panel: the AB cross-correlation (solid line), and the average of the AA and BB autocorrelations (shifted by +417 d; dashed line) in the g band for α = 6 d. Bottom left panel: the fluxes of Q0957+561A (shifted forwards in time in 417 d; filled squares) and Q0957+561B (open squares) in the r band. Bottom right panel: the AB cross-correlation (solid line), and the average of the AA and BB autocorrelations (shifted by +417 d; dashed line) in the r band for α = 9 d.
Current usage metrics show cumulative count of Article Views (full-text article views including HTML views, PDF and ePub downloads, according to the available data) and Abstracts Views on Vision4Press platform.
Data correspond to usage on the plateform after 2015. The current usage metrics is available 48-96 hours after online publication and is updated daily on week days.
Initial download of the metrics may take a while.