Fig. 1
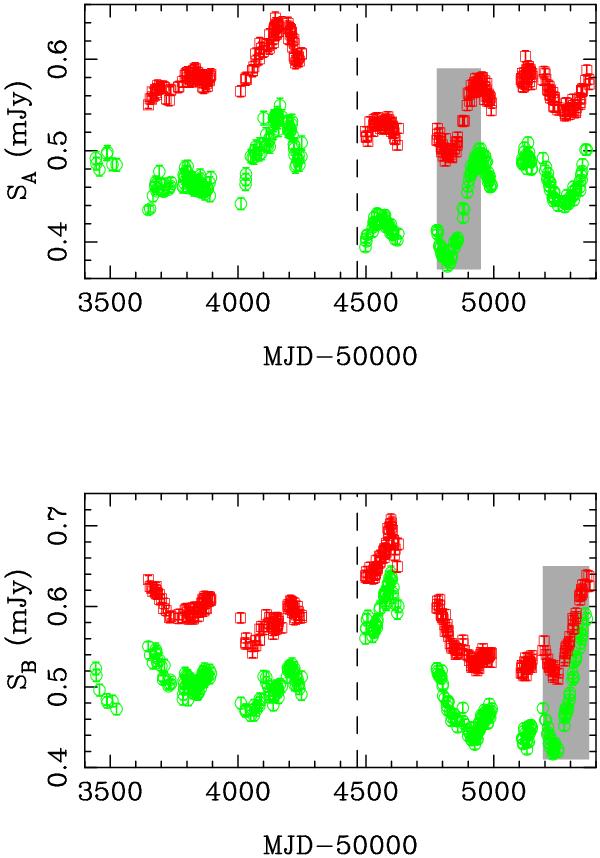
Fluxes of Q0957+561A (top panel) and Q0957+561B (bottom panel) in the g and r bands of the SDSS photometric system. Circles denote the g-SDSS light curves and squares represent the r-SDSS records. The whole optical data set is separated into two parts by a vertical dashed line: LQLM I (2005–2007) and LQLM II (2008–2010). The new effort in the 2008–2010 period doubles our contribution to the two-colour variability database of Q0957+561. We also highlight the LRT main fluctuations using grey rectangles (see main text).
Current usage metrics show cumulative count of Article Views (full-text article views including HTML views, PDF and ePub downloads, according to the available data) and Abstracts Views on Vision4Press platform.
Data correspond to usage on the plateform after 2015. The current usage metrics is available 48-96 hours after online publication and is updated daily on week days.
Initial download of the metrics may take a while.