Fig. 5
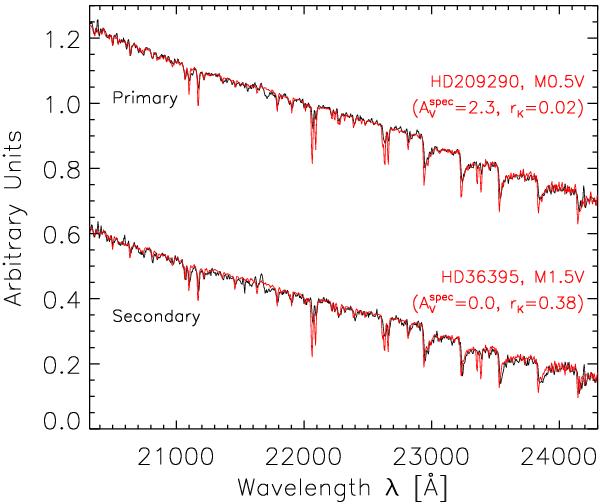
The result of the spectral template fitting for the primary and secondary component of JW 876. The black curves show the spectrum of the primary and secondary component respectively, offset for clearer visibility. The red curves are the corresponding best-fit models from the IRTF spectral library, modified according to Eq. (1) with extinction and veiling values from Table 6.
Current usage metrics show cumulative count of Article Views (full-text article views including HTML views, PDF and ePub downloads, according to the available data) and Abstracts Views on Vision4Press platform.
Data correspond to usage on the plateform after 2015. The current usage metrics is available 48-96 hours after online publication and is updated daily on week days.
Initial download of the metrics may take a while.