Fig. 3
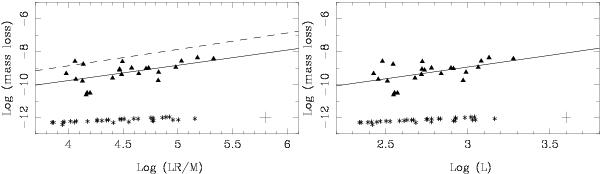
Mass-loss rate plotted against LR/M (for a mass of 1 M⊙) and L. Stars for which no mass loss could be detected (an optical depth of 10-5) are plotted as crosses. The solid lines indicate least squares fits to the data (see Table 3), while the dashed line represents Reimers law with η = 0.35. The cross in the lower right corner indicates a typical error bar.
Current usage metrics show cumulative count of Article Views (full-text article views including HTML views, PDF and ePub downloads, according to the available data) and Abstracts Views on Vision4Press platform.
Data correspond to usage on the plateform after 2015. The current usage metrics is available 48-96 hours after online publication and is updated daily on week days.
Initial download of the metrics may take a while.