Fig. 9
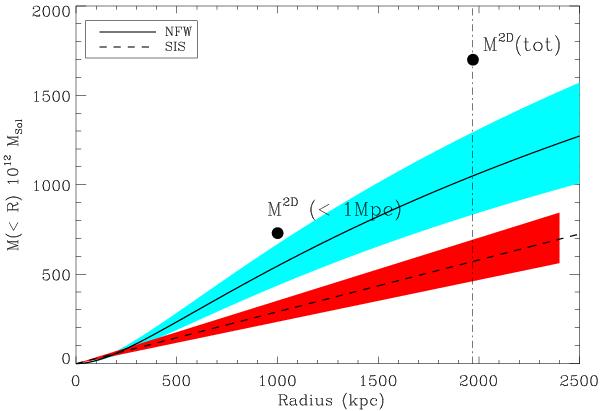
Integrated mass profiles obtained with the best-fit parameters of the SIS and NFW density profiles. The values of the projected mass directly measured on the 2D mass map and integrated up to the radii 1 Mpc and 2 Mpc (≃r200) are plotted for comparison. They correspond to projected masses inside cylinders so they overestimate the mass by ~ 25%. The total mass also includes the contribution of A2163-B with a mass of ~2 . The vertical dashed line corresponds to the position of the virial radius r200.
Current usage metrics show cumulative count of Article Views (full-text article views including HTML views, PDF and ePub downloads, according to the available data) and Abstracts Views on Vision4Press platform.
Data correspond to usage on the plateform after 2015. The current usage metrics is available 48-96 hours after online publication and is updated daily on week days.
Initial download of the metrics may take a while.