Fig. 7
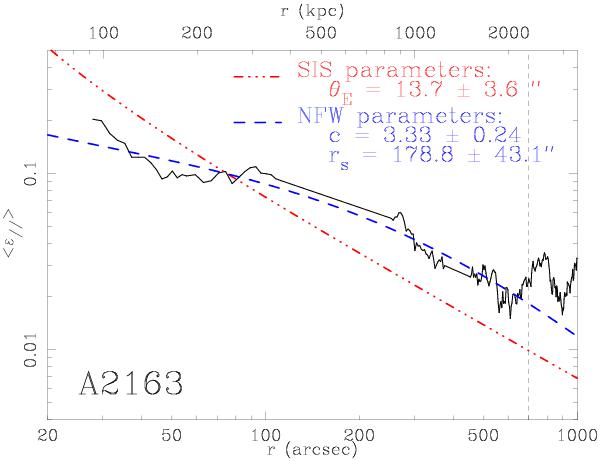
Measured shear profile, averaged in sliding windows (circular annular rings of 110′′ each). Data with 100″ < r < 250″ or 375″ < r < 450″ have been removed from the fit because radial signal may be perturbed by the additional mass clumps A2 or B. The best fit with an SIS mass profile and an NFW one are plotted. The fit is limited to 700′′ around the cluster center because the signal is not significant enough at a greater distance.
Current usage metrics show cumulative count of Article Views (full-text article views including HTML views, PDF and ePub downloads, according to the available data) and Abstracts Views on Vision4Press platform.
Data correspond to usage on the plateform after 2015. The current usage metrics is available 48-96 hours after online publication and is updated daily on week days.
Initial download of the metrics may take a while.