Free Access
Fig. 5
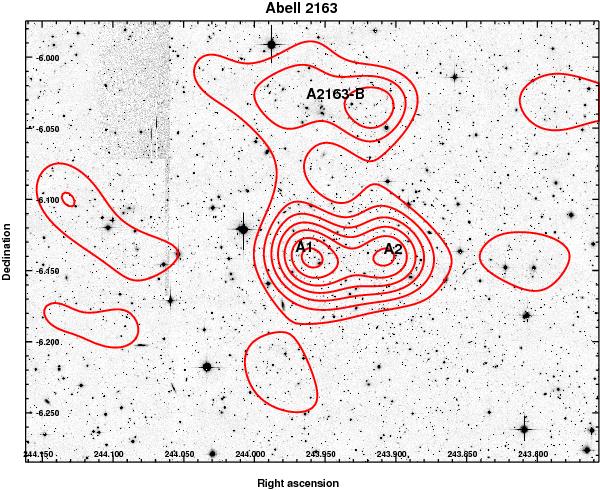
MegaCam r′ image of the cluster Abell 2163, overlaid with the mass map reconstruction. The lowest contour corresponds to the 2σ level and the following ones are scaled with σ. The clump A2163-B is detected at the 3.5σ level.
Current usage metrics show cumulative count of Article Views (full-text article views including HTML views, PDF and ePub downloads, according to the available data) and Abstracts Views on Vision4Press platform.
Data correspond to usage on the plateform after 2015. The current usage metrics is available 48-96 hours after online publication and is updated daily on week days.
Initial download of the metrics may take a while.