Fig. 3
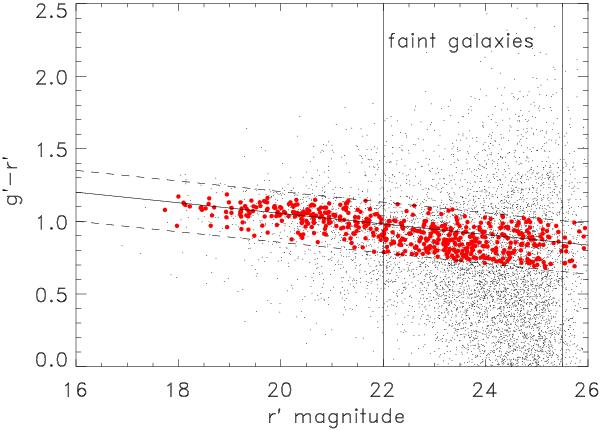
Color–magnitude plot of the galaxies in the field of Abell 2163, located within a 10′ radius from the central galaxy BCG1. The straight line corresponds to the cluster red sequence (RS), and the dashed lines define the window for selecting “cluster members”. Galaxies located less than 200′′ from the cluster center and within the selection window are plotted as large dots.
Current usage metrics show cumulative count of Article Views (full-text article views including HTML views, PDF and ePub downloads, according to the available data) and Abstracts Views on Vision4Press platform.
Data correspond to usage on the plateform after 2015. The current usage metrics is available 48-96 hours after online publication and is updated daily on week days.
Initial download of the metrics may take a while.