Fig. 10
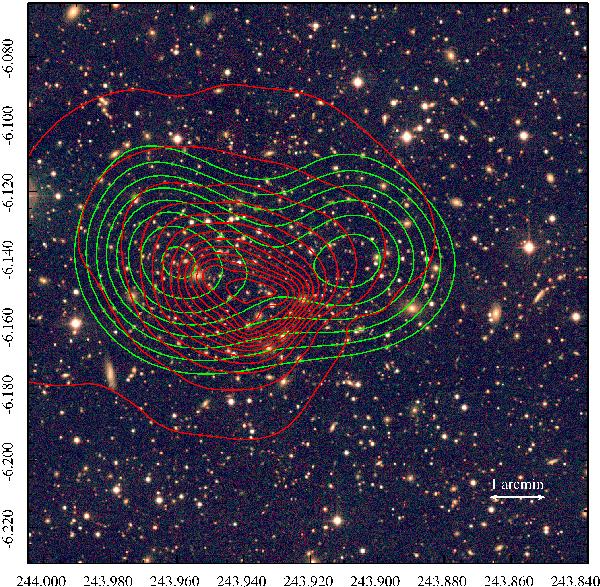
Multi-color image of the center of the cluster Abell 2163 with overlays of the dark matter distribution (green contours from the lensing map) and of the gas distribution (red contours for the Chandra X-rays image, courtesy Bourdin). The shift between the two mass clumps is 3′, while the distance between the X-ray maximum and the eastern clump A2163-A1 is 1.2′. The total size is 10′ × 10′.
Current usage metrics show cumulative count of Article Views (full-text article views including HTML views, PDF and ePub downloads, according to the available data) and Abstracts Views on Vision4Press platform.
Data correspond to usage on the plateform after 2015. The current usage metrics is available 48-96 hours after online publication and is updated daily on week days.
Initial download of the metrics may take a while.