Fig. 2
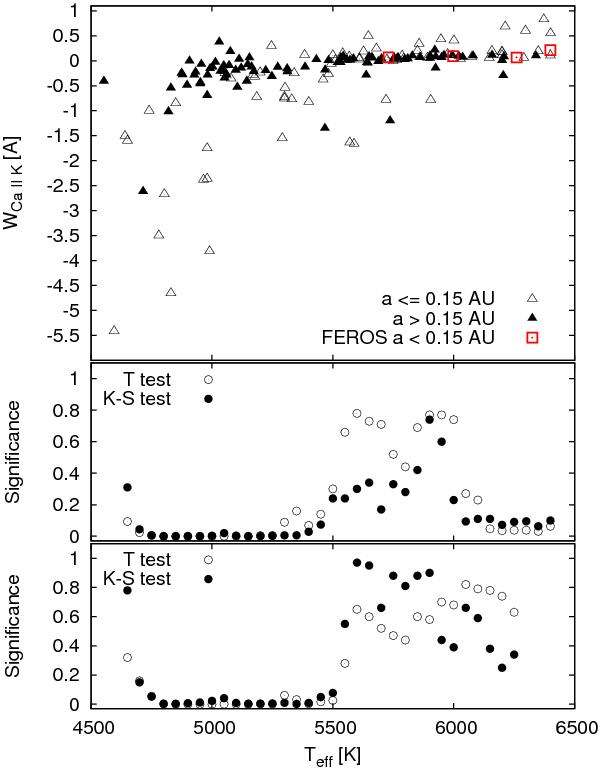
Top: dependence of the equivalent width of the Ca II K emission on temperature of the parent star. Empty triangles denote exoplanetary systems with a ≤ 0.15 AU, full triangles are systems with a > 0.15 AU, and red squares are our data from FEROS. Emission and chromospheric activity increase with decreasing temperature. Cooler stars (Teff ≤ 5500 K) with close-in planets are more active than stars with more distant planets. Middle: statistical Student’s t-test (empty circles) and Kolmogorov-Smirnov test (full circles) show whether the two distributions are the same. Bottom: the same statistical tests performed on systems discovered by the RV technique alone.
Current usage metrics show cumulative count of Article Views (full-text article views including HTML views, PDF and ePub downloads, according to the available data) and Abstracts Views on Vision4Press platform.
Data correspond to usage on the plateform after 2015. The current usage metrics is available 48-96 hours after online publication and is updated daily on week days.
Initial download of the metrics may take a while.