Fig. 3
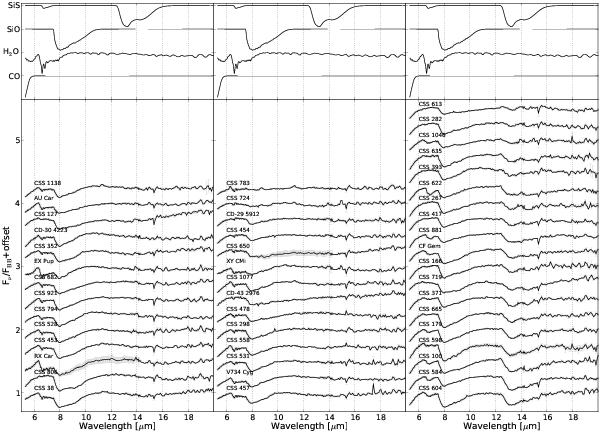
Top panel: the template spectra of SiS, SiO, H2O, and CO. Bottom panel: the spectra of all naked stars from 5 μm to 20 μm, normalized with a blackbody spectrum. The the two panels on the left show the stars without SiS, the right-most panel shows all stars with significant SiS absorption. The sharp feature at 15.3 μm seen in all stars is most likely an artifact of the data reduction process.
Current usage metrics show cumulative count of Article Views (full-text article views including HTML views, PDF and ePub downloads, according to the available data) and Abstracts Views on Vision4Press platform.
Data correspond to usage on the plateform after 2015. The current usage metrics is available 48-96 hours after online publication and is updated daily on week days.
Initial download of the metrics may take a while.