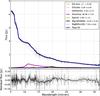
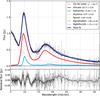
Fig. A.1
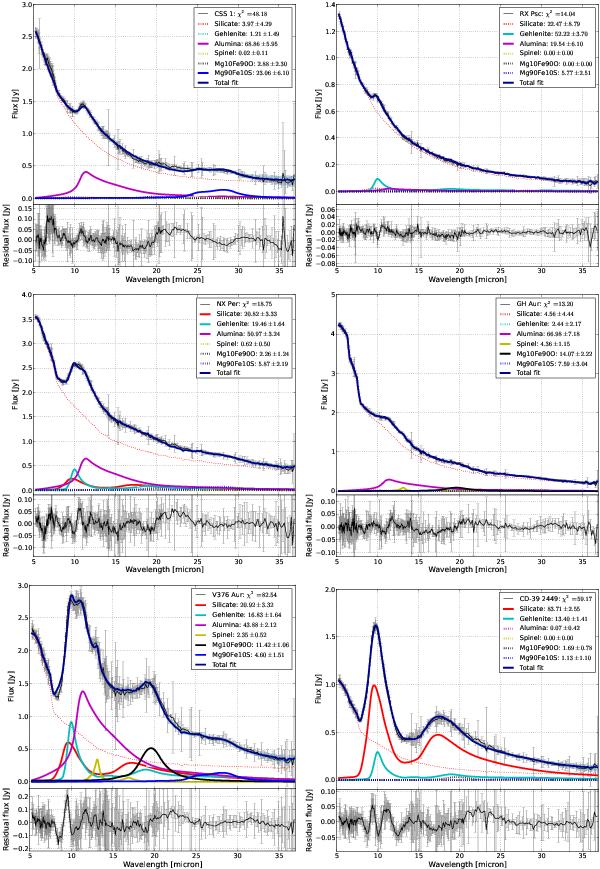
The results of the dust decomposition tool for all stars with dust features. Top panel: the black line shows the Spitzer spectrum, the red dotted line the fit the underlying estimate for the stellar continuum, as derived from the dust decomposition tool and the solid, dark blue line indicates the total fit to the spectrum. Solid lines shown in the legend indicate significant contributions to the spectrum, the dotted lines the non-significant contributions. Bottom panel: the residuals after subtracting the total fit.

Current usage metrics show cumulative count of Article Views (full-text article views including HTML views, PDF and ePub downloads, according to the available data) and Abstracts Views on Vision4Press platform.
Data correspond to usage on the plateform after 2015. The current usage metrics is available 48-96 hours after online publication and is updated daily on week days.
Initial download of the metrics may take a while.