Fig. 4
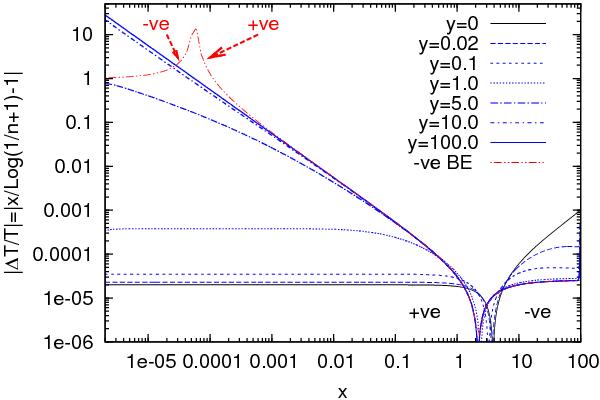
Evolution of initial spectrum at y = 0 given by Eq. (18)with − YSZ = YBEC = 10-5. |ΔT/T| ≡ |Teff/T − 1| is plotted, where Teff is the temperature of a blackbody spectrum with the corresponding intensity at a particular frequency. Bose-Einstein spectrum defined by n(ν) = 1/(ehν/kBTe + μ − 1) with negative μ is labeled “-ve BE”, red dashed, double-dotted line in the figure. The distortions are positive in the Rayleigh-Jeans region (labeled “+ve”) on the left side and negative in the Wien region (labeled “-ve”) on the right side of the figure.
Current usage metrics show cumulative count of Article Views (full-text article views including HTML views, PDF and ePub downloads, according to the available data) and Abstracts Views on Vision4Press platform.
Data correspond to usage on the plateform after 2015. The current usage metrics is available 48-96 hours after online publication and is updated daily on week days.
Initial download of the metrics may take a while.