Fig. 1
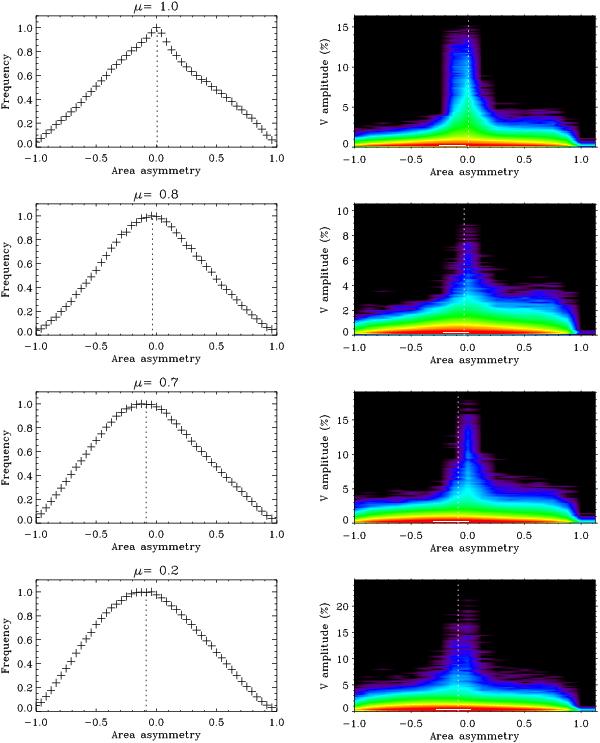
Histograms for four different heliocentric angles (from top to bottom) of the observed asymmetry in Stokes V profiles of the Fe I line at 6302.5 Å. The left column presents the total histogram, while in the right column it is presented as a function of the amplitude of the profile in the ordinate axis and with histogram values in color. For better visibility the logarithm of the actual value is shown. A vertical dashed line marks the position of the maximum of the histogram in all plots.
Current usage metrics show cumulative count of Article Views (full-text article views including HTML views, PDF and ePub downloads, according to the available data) and Abstracts Views on Vision4Press platform.
Data correspond to usage on the plateform after 2015. The current usage metrics is available 48-96 hours after online publication and is updated daily on week days.
Initial download of the metrics may take a while.