Fig. 4
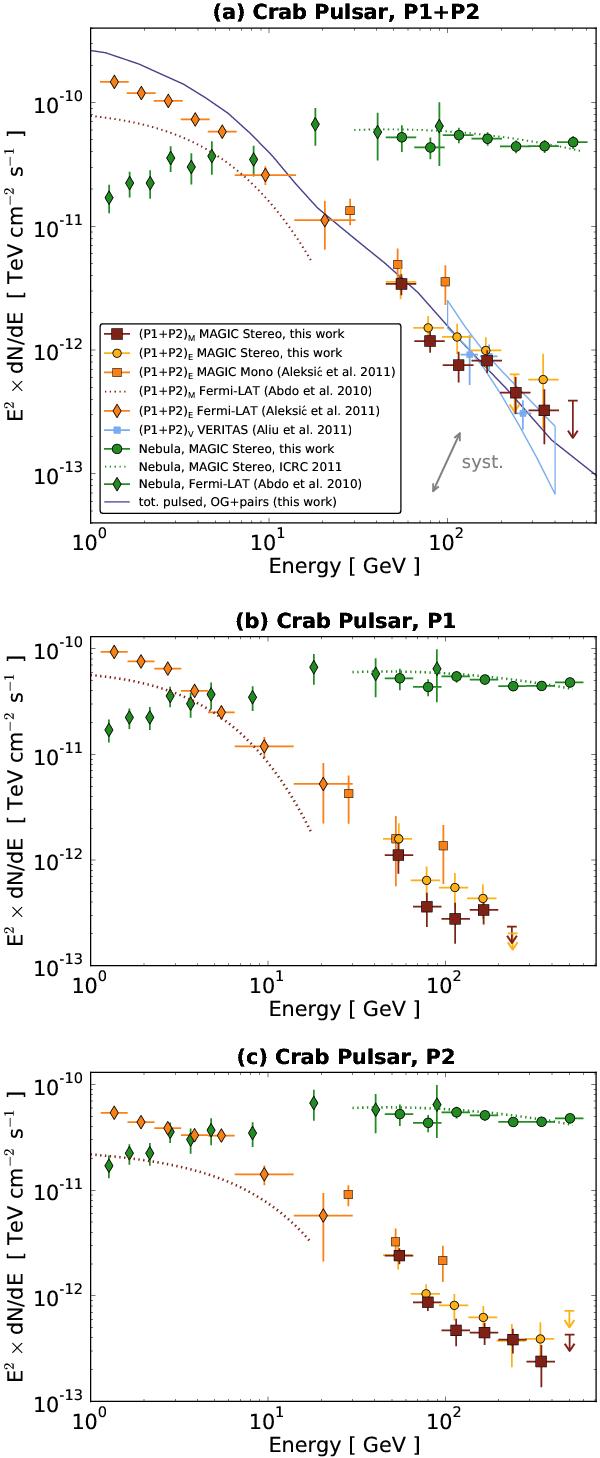
Compilation of the spectral measurements of MAGIC and Fermi-LAT for the two emission peaks P1 and P2, separately b), c) and for both peaks together a). The VERITAS spectrum is only available (and shown) for P1V + P2V (light blue squares and solid line). For comparison, the Crab nebula measurements of MAGIC and Fermi-LAT (excluding the pulsed component) are also shown (green solid circles and diamonds, resp.). Points of similar color refer to the same phase intervals (dark red for MAGIC, yellow for EGRET, blue for VERITAS intervals, and green points for the nebula spectrum, see also text). The blueish solid line in the upper plot is the model discussed in Sect. 4 and it is above the points because it includes the bridge emission. The displayed systematic error of the MAGIC-Stereo measurement corresponds to a shift of ± 17% in E and ± 19% in flux.
Current usage metrics show cumulative count of Article Views (full-text article views including HTML views, PDF and ePub downloads, according to the available data) and Abstracts Views on Vision4Press platform.
Data correspond to usage on the plateform after 2015. The current usage metrics is available 48-96 hours after online publication and is updated daily on week days.
Initial download of the metrics may take a while.