Fig. 2
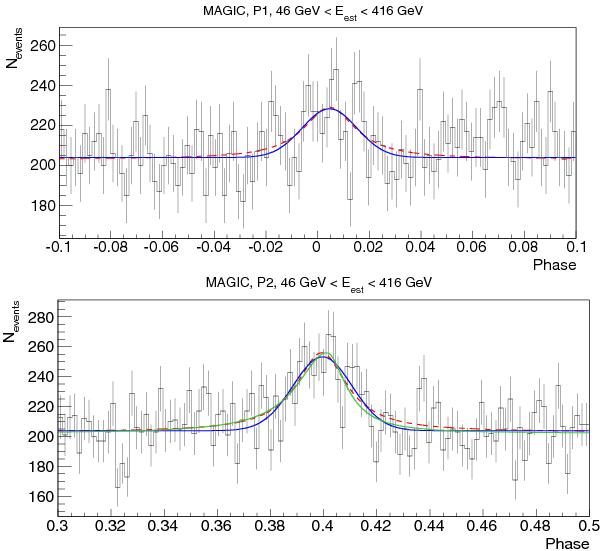
Close-up display of the two fitted peaks P1 and P2 using a finer binning and a smaller range. The blue solid curves represent the Gaussian functions that we use to define the signal phase intervals. The red dashed curves are the Lorentzian functions, which allow for wider tails, and the green solid curve is an asymmetric Lorentzian function. The latter did not converge for P1 (see text).
Current usage metrics show cumulative count of Article Views (full-text article views including HTML views, PDF and ePub downloads, according to the available data) and Abstracts Views on Vision4Press platform.
Data correspond to usage on the plateform after 2015. The current usage metrics is available 48-96 hours after online publication and is updated daily on week days.
Initial download of the metrics may take a while.