Free Access
Fig. 1
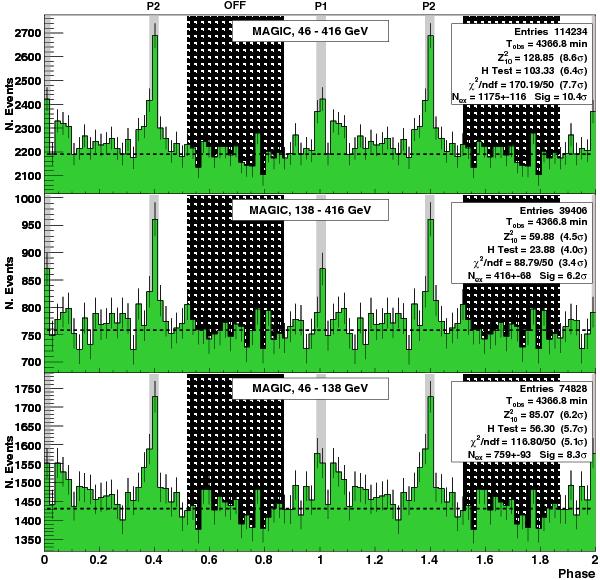
MAGIC folded light curves of the Crab pulsar for our total range in estimated energy and for two separate sub-bins. The shaded areas are the on-phase regions P1M and P2M (see text), the light shaded area is the off-region [0.52−0.87] . The dashed line is the constant background level calculated from that off-region.
Current usage metrics show cumulative count of Article Views (full-text article views including HTML views, PDF and ePub downloads, according to the available data) and Abstracts Views on Vision4Press platform.
Data correspond to usage on the plateform after 2015. The current usage metrics is available 48-96 hours after online publication and is updated daily on week days.
Initial download of the metrics may take a while.